Los Angeles, CA — The latest investor profits reports show that California oil refiners are making unprecedented profits from refining oil into gasoline in the first quarter of 2022.
Some California oil refiners report profits from the first quarter of 2022 that are more than twice as high as those reported by the same refiners in other regions and as much as five times more than in the first quarter of 2021.
“Despite the oil industry’s claims that the $1.50 extra per gallon Californians pay at the pump is due to taxes and environmental standards, first quarter profit reports show that California is nothing more than an ATM for oil refiners,” said Jamie Court, president of Consumer Watchdog.
“These profit reports show the Golden State Gouge is real. Oil refiners exploited the crisis in Ukraine to make a mint from California drivers.”
PBF Energy reports its crack spreads – the difference between the price of the crude oil it processes and petroleum products it sells – from both of its refineries in California on a quarterly basis.
For the first quarter of 2022, PBF’s profits from its LA refinery grew to $32.84 per barrel from $15.75 per barrel in the first quarter of 2021. With 42 gallons in a barrel of gasoline, this means that PBF made about 78 cents per gallon on the gasoline it sold in Los Angeles from January 1 thru March 31st. That compares to 37 cents per gallon profits in LA in Q1 2021and 42 cents per gallon profit from its Midwest refinery in the first quarter of 2022.
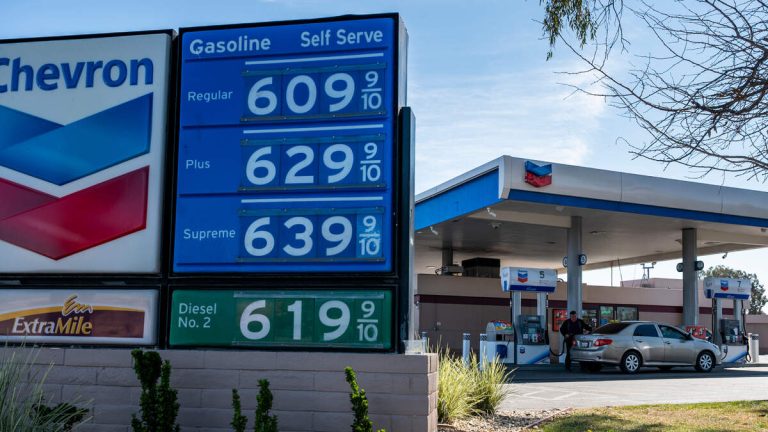
“Since prices only tipped $6 per gallon well into the reporting period, this means that PBF likely made $1 per gallon profits on the gasoline sold in Southern California from March through May,” said Court. “That’s an obscene level of profits that should be a wake up call in Sacramento.”
With gasoline prices skyrocketing only at the end of Q1, this shows the extreme profits California oil refiners have been making off the opportunity to charge more based on the increase in world crude oil prices. California oil refiners charge gasoline prices reflective of $109 per barrel crude oil prices. Profit reports reveal, however, that their crude oil costs are significantly less, leading to the unprecedented refining margins compared to previous California margins and margins across the rest of America.
Most California refiners don’t break out their margins by refinery as PBF does, but all report margins or crack spreads on a Western regional basis. Given that California has the highest gas prices in America, $1.50 more per gallon than US gasoline prices, the California refining margins for these companies, if reported by state and not region, would almost certainly be greater than reported in Western region margins.
SB 1322 (Allen), sponsored by Consumer Watchdog, requires every California oil refiner to report their per barrel profit margins monthly. “With this information, California officials will be equipped to respond to periods of gouging like we are currently seeing,” said Court. “The legislature needs to pass SB 1322 on an urgency basis with a two-thirds vote so that it can take effect immediately and we can monitor profit spikes this summer.”
Chevron reports its refinery margins on a regional basis, but not by quarter, only year. Still, Chevron’s first quarter profit report indicated “U.S. downstream operations reported earnings of $486 million in first quarter 2022, compared with a loss of $130 million a year earlier. The increase was mainly due to higher margins on refined product sales and higher earnings from the 50 percent-owned Chevron Phillips Chemical Company.”
Marathon’s Western region crack spread was $19.99 per barrel in Q1 2022, compared to $12.35 in the Midwest and $13.80 in 2021 in the West.
Profits Per Gallon—West Coast Region
Oil Company 1st Q 2022 2021 2020
| Chevron Profits Per Gallon |
N/A |
37 Cents | 24 Cents |
| Marathon Profits Per Gallon |
47 Cents vs 28 Cents 1st Q 2021 |
33 Cents | 22 Cents |
| PBF Energy LA Profits Per Gallon |
78 Cents vs 37 Cents 1stQ 2021 |
48 Cents | 27 Cents |
| PBF Energy SF Profits Per Gallon |
70 Cents vs 30 Cents 1st Q 2021 |
49 Cents | 23 Cents |
| Phillips 66 Profits Per Gallon |
42 Cents vs 7 Cents 1st Q 2021 |
18 Cents | 8 Cents |
| Valero Profits Per Gallon |
33 Cents vs 12 Cents 1st Q 2021 |
23 Cents | 13 Cents |
Phillips 66’s Western refining margins were $17.68 per barrel in Q1 2022, compared to roughly $7 per barrel in its Midwest and Gulf Coast refineries, and $7.49 per barrel in the West in 2021. Remarkably, Phillips 66’s Q1 2021 margins were $3.33 per barrel. The increase from Q1 2021 to Q1 2022 is more than five-fold.
Valero’s Q1 2022 refining margin for its Western region was $13.97 per barrel, which is greater than all its other regions and more than the $9.75 per barrel made in the West Q1 2021. Valero’s Q1 2021 margin was $5.09, so its Q1 2022 margin is more than double.
Profits Per Gallon By First Q 2022 and Year End 2021
Refiner West Coast East Coast Mid-Continent Gulf Coast World
| Chevron Profits Per Gallon |
1st Q ’22: N/A 2021: 37 Cents |
N/A | 1st Q ’22: N/A 2021: N/A |
1st Q ’22: N/A 2021: 31 Cents |
1st Q ’22: N/A 2021:Singapore/Dubai 11 Cents |
| Marathon Profits Per Gallon |
1st Q ’22: 47 Cents 2021: 33 Cents |
N/A | 1st q ’22: 29 Cents 2021: 26 Cents |
1st Q ’22: 38 Cents 2021: 21 Cents |
N/A |
| PBF Energy Profits Per Gallon LA/SF |
1st Q ’22: LA: 78 Cents SF: 70 Cents LA ‘21: 47 Cents SF ‘21: 49 Cents |
1st Q ’22: 51 Cents 2021: 40 Cents |
1st Q’ 22: 42 Cents 2021: 39 Cents |
1st Q’ 22: 57 Cents 2021: 38 Cents |
N/A |
| Phillips 66 Profits Per Gallon |
1st Q ’22: 42 Cents 2021: 17 Cents |
N/A | 1st Q ’22: 19 Cents 2021: 23 Cents |
1st Q ’22: 18 Cents 2021: 11 Cents |
1st Q ’22: Europe: 28 Cents Worldwide: 25 Cents 2021: Europe: 18 Cents Worldwide: 17 Cents |
| Valero Profits Per Gallon |
1st Q ’22: 33 Cents 2021: 23 Cents |
N/A | 1st Q ’22: 24 Cents 2021: 22 Cents |
1st Q ’22: 31 Cents 2021: 20 Cents |
1st Q ’22: 30 Cents 2021: N. Atlantic Region: 23 Cents |
Oil refiners freely share their margins or crack spread, but the measures are inconsistent and not published frequently enough to pinpoint periods of price gouging or specifically for California. SB 1322 would require monthly standardized reporting of California oil refiners’ margins that would allow the public and regulators to pinpoint periods of price gouging.
In addition, existing California Energy Commission data and reports on “refiner margins” do not appear to account for actual crude oil costs of the refiners and are misleading. The margins appear to reflect the world price of crude oil, not the actual costs paid by refiners, who have long term contracts for crude oil and can pay half as much as the world crude price, therefore reaping a huge benefit when crude oil prices skyrocket.
Refining Margins Per Barrel—West Coast Region
Oil Company 1st Q 2022 2021 2020
| Chevron Refining Margin |
N/A |
$15.57 | $10.16 |
| Marathon Crack Spread |
$19.99 vs $12.09 1stQ 2021 | $13.80 | $9.26 |
| PBF Energy LA Crack Spread |
$32.84 vs $15.75 1stQ 2021 |
$20.10 | $11.30 |
| PBF Energy SF Crack Spread |
$29.39 vs $12.92 in 1st Q 2021 | $20.55 | $9.99 |
| Phillips 66 Refining Margin |
$17.68 vs $3.33 in 1st Q 2021 | $7.49 | $3.43 |
| Valero Refining Margin |
$13.97 vs $5.09 in 1st Q 2021 | $9.75 | $5.77 |
Refining Margins Per Barrel 2021 By First Q 2022 and Year End 2021
Refiner West Coast East Coast Mid-Continent Gulf Coast World
| Chevron Refining Margins |
1st Q ’22: N/A 2021: $15.57 |
N/A | 1st Q ’22: N/A 2021: N/A |
1st Q ’22: N/A 2021: $13.29 |
1st Q ’22: N/A 2021:Singapore/Dubai $4.85 |
| Marathon Crack Spreads |
1st Q ’22: $19.99 2021: $13.80 |
N/A | 1st q ’22: $12.35 2021: $10.95 |
1st Q ’22: $16.14 2021: $8.89 |
N/A |
| PBF Energy Crack Spreads LA Crack Spreads SF |
1st Q ’22: LA: $32.84 SF: $29.39 2021: $20.10 2021:$20.55 |
1st Q ’22: $21.69 2021:$16.84 |
1st Q’ 22: $17.94 2021:$16.34 |
1st Q’ 22: $24.14 2021:$16.03 |
N/A |
| Phillips 66 Refining Margins |
1st Q ’22: $17.68 2021:$7.49 |
N/A | 1st Q ’22:$7.89 2021:$9.65 |
1st Q ’22: $7.71 2021: $4.92 |
1st Q ’22: Europe: $11.71 Worldwide: $10.55 2021: Europe: $7.48 Worldwide: $7.15 |
| Valero Refining Margins |
1st Q ’22:$13.97 2021:$9.75 |
N/A | 1st Q ’22:$10.45 2021: $9.59 |
1st Q ’22:$13.13 2021: $8.60 |
1st Q ’22: $12.87 2021: N. Atlantic Region: $9.81 |