ACKNOWLEDGEMENTS The opinions expressed in this report are solely those of Consumer Watchdog and do not reflect the opinions of the Container Recycling Institute. CRI provided valuable technical assistance but any conclusions, assertions and statements are those of Consumer Watchdog only.
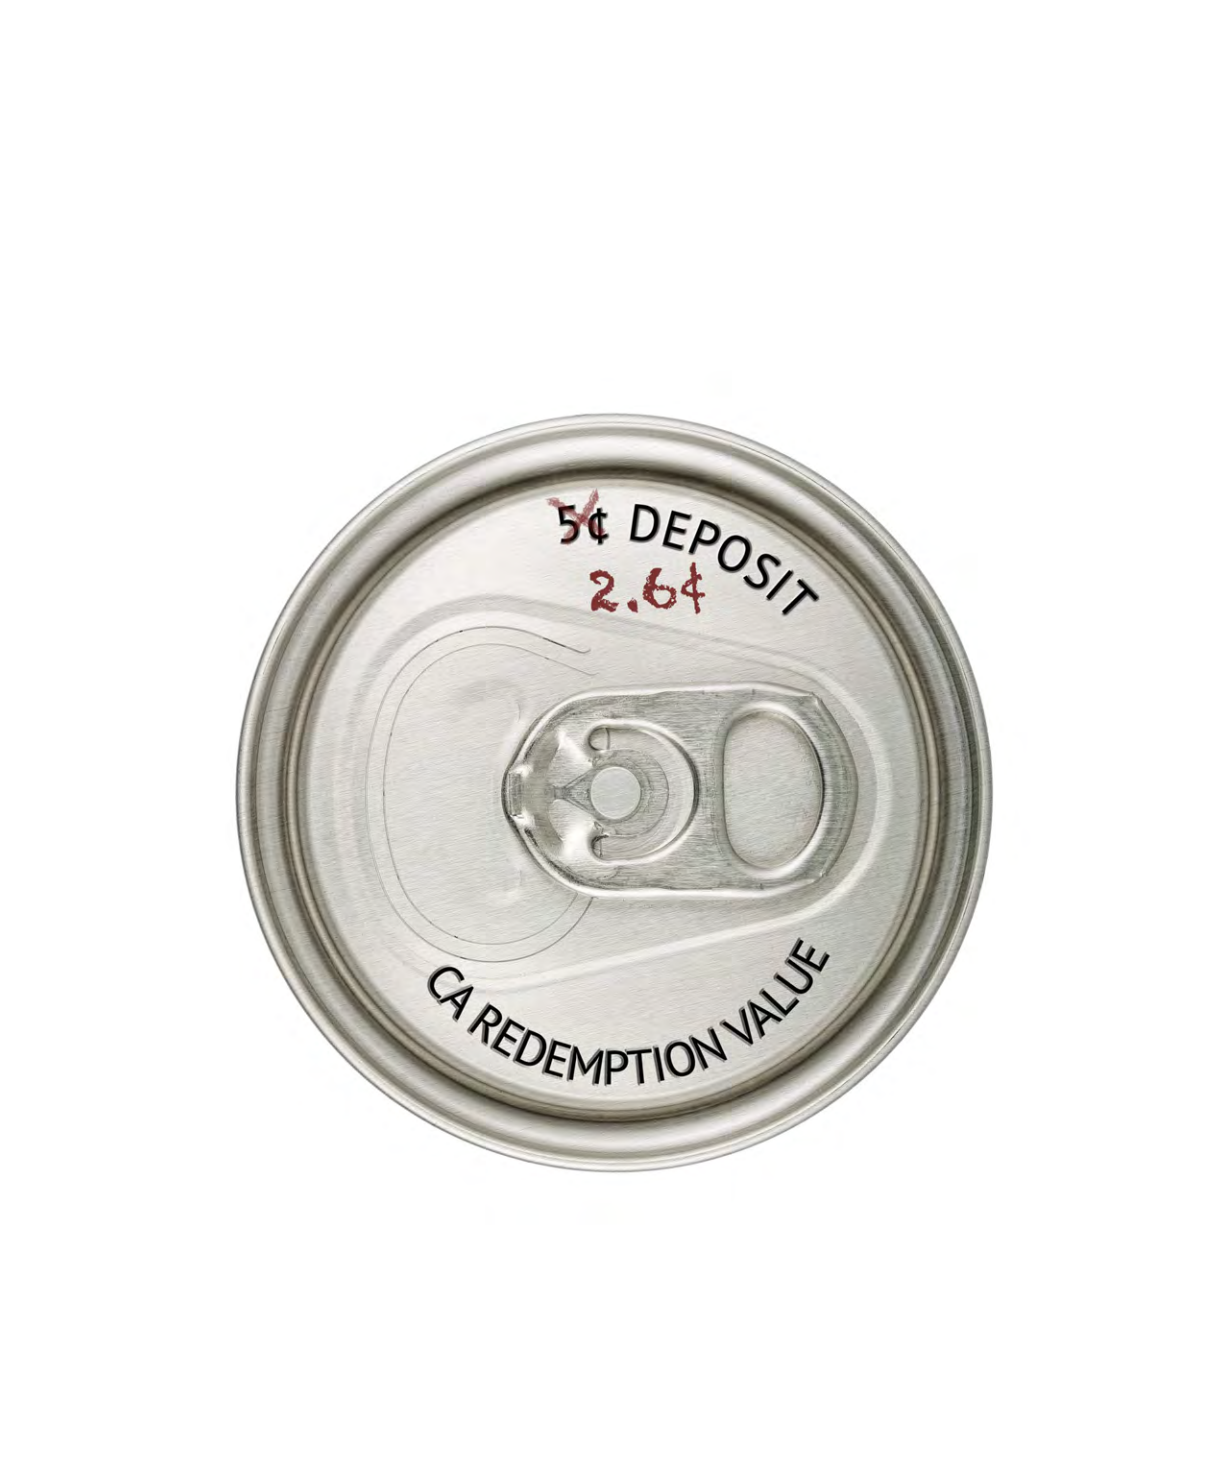
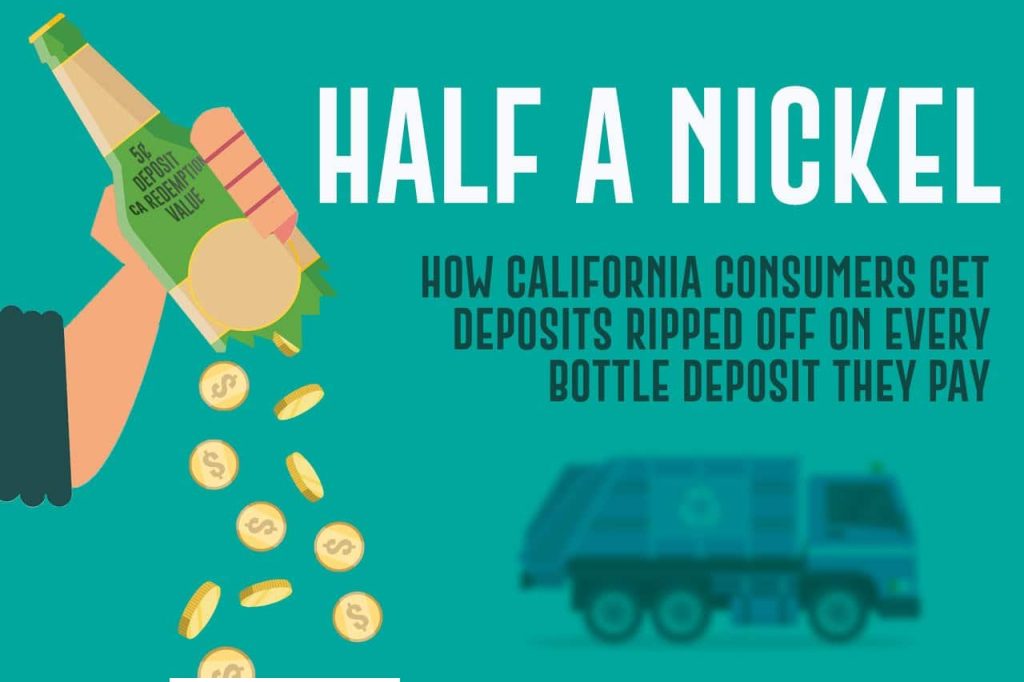
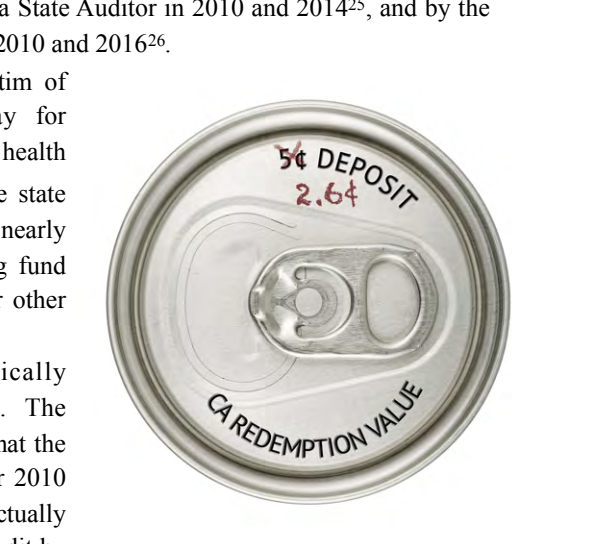
HALF A NICKEL HOW CALIFORNIA CONSUMERS GET RIPPED OFF ON EVERY BOTTLE DEPOSIT THEY PAY For every nickel bottle deposit that California consumers pay in the checkout line, they only get back 2.65 cents.
A three-month investigation by Consumer Watchdog found the reason is a failing state recycling system that leaves consumers fewer options every year on where to redeem their empties while letting special interests—from grocery chains to beverage distributors and trash haulers—get rich at the consumer’s expense.
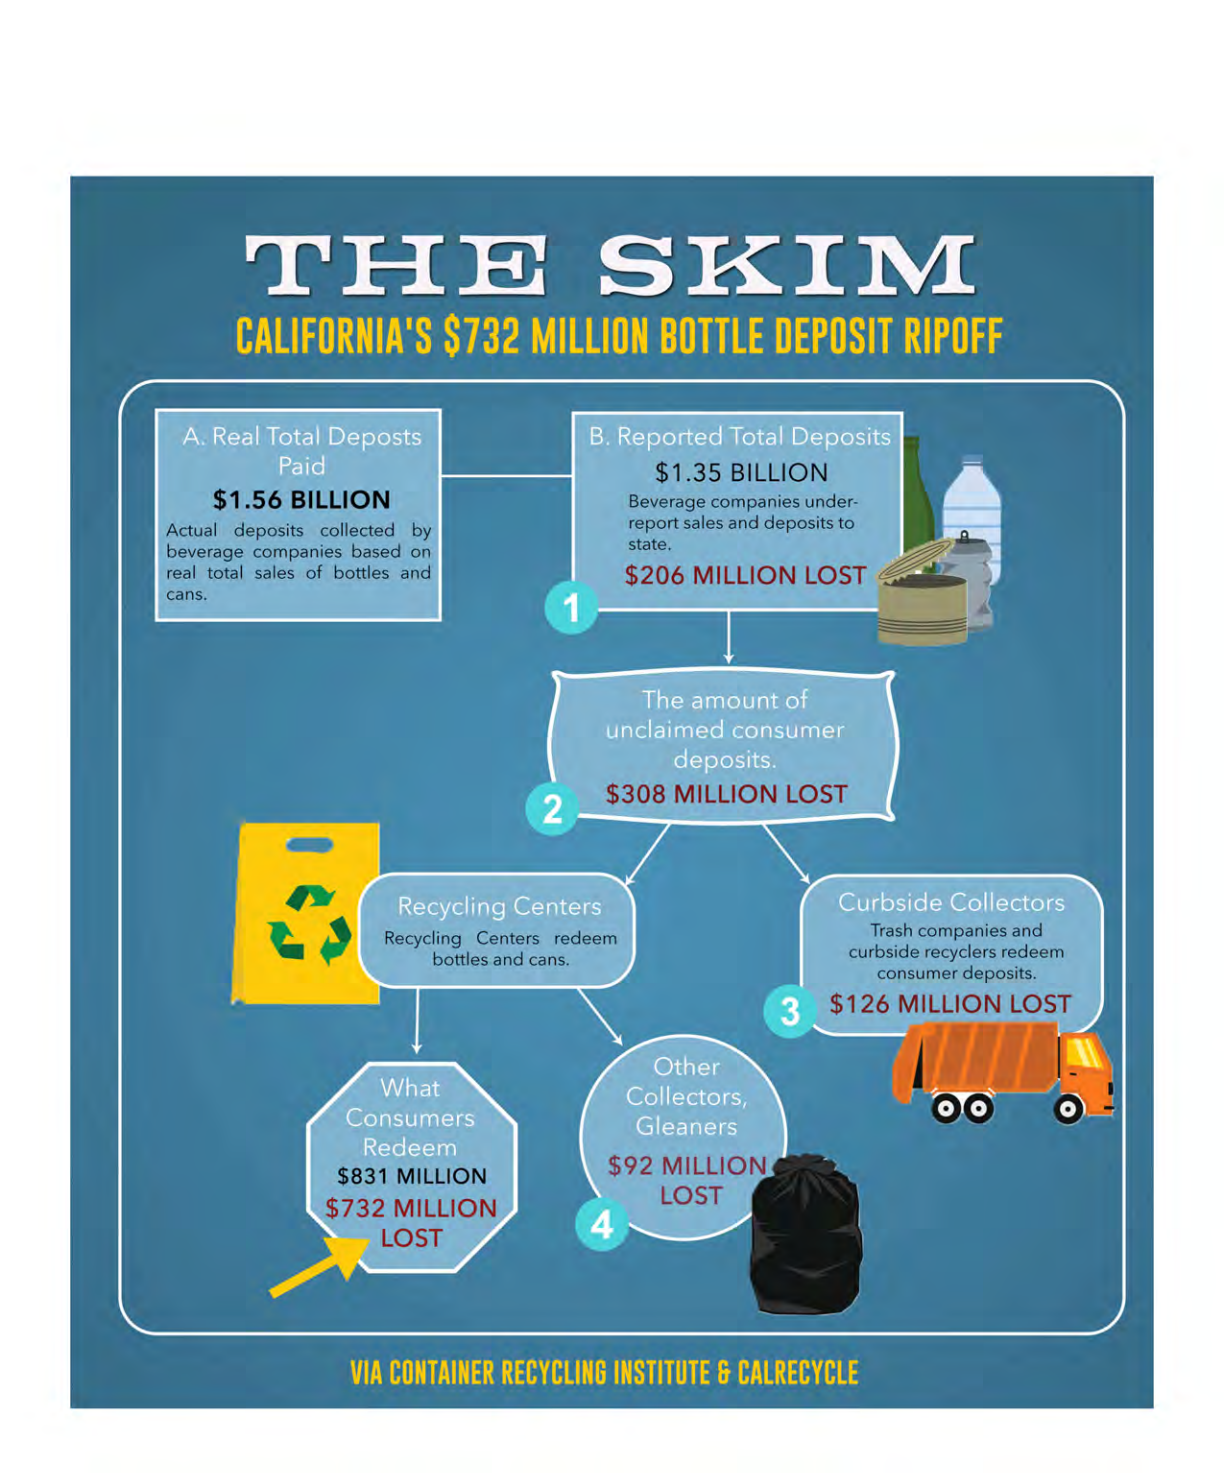
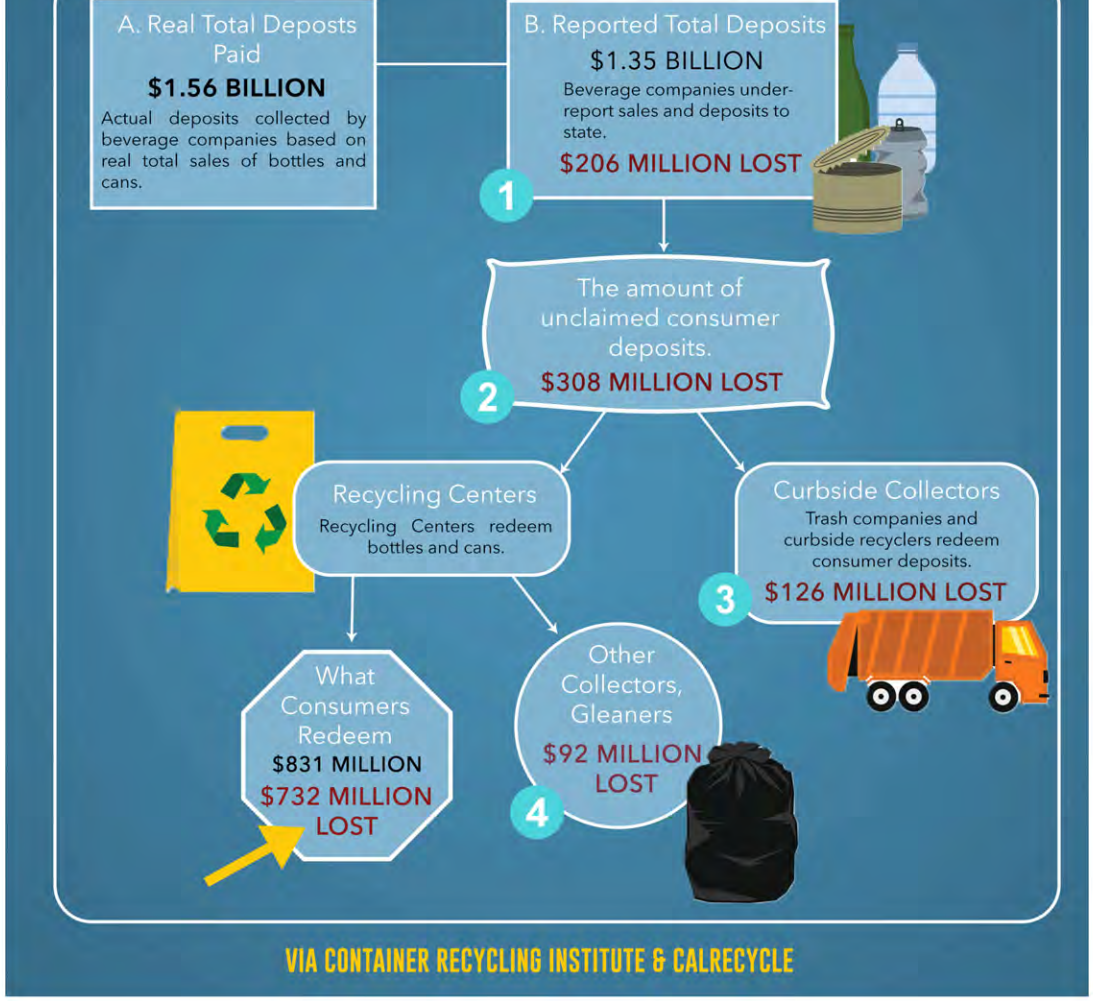
Over the last five years, consumers have been steadily losing millions more each year on their deposits, reaching a high of $308 million in deposits they never redeemed in fiscal year 2017-2018, according to California’s Department of Resources Recycling and1 Recovery (CalRecycle). However, the investigation found the true total annual cost of the consumer rip-off was $732 million because of additional ways that consumers were deprived of their deposits (see charts on pages 3 & 4). California consumers that made deposits only received 53% of the deposits back directly.
The public interest group’s investigation found:
- Forty percent of state-certified recycling centers have closed in the last five2 years with hundreds more closings on the way. That leaves more bottles and cans unredeemed by consumers while increasing revenue for waste and curbside haulers.
Recycling center closures also hurt communities via job losses and critical ‣ income for families and individuals who gather discarded cans and bottles to earn extra cash.
‣Grocery and big box chains are not taking back bottles and cans despite a legal obligation to do so.
Accounting scams by retailers and beverage distributors such as Walmart are ‣ prevalent. They are supposed to keep count and pass on the paid deposit for every bottle they sell. But state audits and market research show they under-report how much they owe consumers and keep the difference.
CalRecycle, the state agency overseeing California’s beverage container ‣ recycling program, has not publicly imposed a fine against distributors that !1.
scam the system or retailers that deny access, ︎︎︎according to a review of publicly posted press releases for the last five years.
Politically-connected waste and curbside haulers cash in on the bottle and can ‣ deposits that are supposed to go to consumers. They are paid a state premium on top, even though the haulers’ lax processing leaves their recycling materials increasingly contaminated and landfilled.
‣ CalRecycle has accumulated a vast reserve of roughly $300 million as of 2018 while failing to pay recycling centers enough to survive. This money should be used to preserve and grow recycling centers that produce clean recyclable materials and to enforce the bottle law via audits and fines for companies caught holding back consumer deposits.
FOR CONSUMERS, ACCESS DENIED Every time a consumer pays a nickel or dime deposit for a beverage, they are supposed to get that money back. These nickels and dimes fund recycling centers that take empties and refund deposits, and provide easy access for enterprising consumers collecting large amounts of bottles and cans for redemption. The deposits also fund enforcement of the state’s 1986 bottle law to ensure that the state gets the required4 deposits and other fees from the beverage industry.
Instead, 40 percent of the state’s recycling centers—more than one thousand out of5 2,600 since 2013—have closed, according to CalReycle data. To put that in perspective, some Californians would have to travel as far as 167 miles to reach a center. By contrast, Michigan residents return their bottles to retailers required to take them. They have to travel no more than 15 miles to find one. Michigan’s official recycling rate stands at 92 percent while California’s official rate has fallen to 75 percent in 2017 from 85 percent in 2013. Counting in the scams, and special interest giveaways, California consumers only6 received a direct return of 53 percent of every nickel or dime they put in a bottle or can. ︎︎ California retailers are the backstop for the program in locations where no redemption centers exist. But they resist taking responsibility. Among the ten states, California has the worst accessibility with an average of one center serving 26,0007 Californians. That leads to more consumers, sick of driving too far or standing in lines, throwing their empties into the trash.
The ten worst-served counties have on average only one redemption center for every 60,000 people, according to an analysis of CalRecycle data by the Container !2.
THE SKIM CALIFOR$N7I3A2M’S I LLIOBON TTDLEEP ORSIIPTO FF
B. Rer2or.ted ifotal Der2osits ‘, :
g
;t;t;.6 MILLION LOST
VIAC ONTARINEECRY CILNINSGTI TU&C TEA LRECYCLE
!3.
(see graphic How Much of the Deposit Why Consumers Lose $206 million $308 million $126 million $92 million $732 million $831 Million 2.65¢ for every nickel, 5.3¢ for every dime !4.
(see graphic P. 3) How Much of the Deposit Consumers Lose Why 1 $206 million Under-reported deposits: The gap between what the state reports consumers paid in bottle deposits ($1.35 billion) and market research showing that consumers paid $206 million more ($1.56 billion) that they never got back. [SOURCE: CRI’s report: Examining the Potential for Increased Revenues in California’s Beverage Container Deposit-Return Program, August 13, 2014, page 4] 2 $308 million The actual amount of unclaimed consumer deposits. [SOURCE: CalRecycle Fact Sheet 2018] 3 $126 million Cash hauled in by curbside haulers and trash companies redeeming deposits rather than consumers. (12%) [SOURCE: CalRecycle Fact Sheet, 2018] 4 $92 million Amount that goes to bulk collectors and “gleaners” but does not go back to consumers who made the deposit. [SOURCE: Estimated at 10% of collections at redemption centers.] Total Deposits Loss $732 million The amount that consumers lose in deposits. (47%) [$1.56 Billion – Items 1,2,3,4 Above ] Total Deposits Redeemed $831 Million The amount consumers get back in deposits. Average 2.65¢ for every nickel, 5.3¢ for every dime The actual redemption rate (53%)
Recycling Institute (CRI). Eight of those counties are in the Bay Area. In Marin County, each center has to serve 131,000 people.
Four counties—Sonoma, Tuolumne, Mariposa and Butte—have lost two thirds or more of their centers in just five years. Los Angeles County has lost the biggest number of centers in that time period—108 of them.
In 2013, Californians had 2,600 available recycling centers. Today, the number is approaching 1,500, according to CalRecycle’s statistics. The state could lose at least another 400 centers this year, based on CalRecycle data showing that many centers have8 costs higher than the payments they will get from the state.
The fundamental problem is a rigid and outdated payment formula, set in the law, and CalRecycle’s dogged failure to call for its reform. Without change, the recycling centers that are the centerpiece of the state’s bottle deposit law are doomed.
Counties that Have Lost the Greatest Number of Centers, 2012 to 2017
No. of No. of No. of No. of People served/ Recycling Recycling Recycling Recycling redemption County Centers Centers Centers Centers % center, 2017 (2012)(2017)LostChange Los Angeles58547710818%21,470 Sacramento132557758%27,541 San Diego1431034028%32,196 Kern128893930%10,057 Orange1501193121%26,841 San Bernardino1561253120%17,282 San Joaquin59312847%24,093 Riverside1461182819%20,210 Tulare71442738%10,724 Santa Clara58322645%60,568 !5.
| County | No. of Recycling Centers (2012) | No. of Recycling Centers (2017) | No. of Recycling Centers Lost | No. of Recycling Centers % Change | People served/ redemption center, 2017 |
|---|---|---|---|---|---|
| Los Angeles | 585 | 477 | 108 | 18% | 21,470 |
| Sacramento | 132 | 55 | 77 | 58% | 27,541 |
| San Diego | 143 | 103 | 40 | 28% | 32,196 |
| Kern | 128 | 89 | 39 | 30% | 10,057 |
| Orange | 150 | 119 | 31 | 21% | 26,841 |
| San Bernardino | 156 | 125 | 31 | 20% | 17,282 |
| San Joaquin | 59 | 31 | 28 | 47% | 24,093 |
| Riverside | 146 | 118 | 28 | 19% | 20,210 |
| Tulare | 71 | 44 | 27 | 38% | 10,724 |
| Santa Clara | 58 | 32 | 26 | 45% | 60,568 |
The state uses money from the program to offset recyclers’ costs when the cost of recycling containers exceeds the value of the recovered scrap, which is the case with glass and plastic. But CalRecycle’s calculations lag far behind real time prices on the changing scrap market at home and abroad.
The state also averages the cost of container recycling across all of the state’s recycling centers to arrive at the amount of a payment for services. Using an average automatically means underpaying the highest cost centers. They include those in high-rent urban locations, for example San Francisco, and centers in rural locales where recycling volumes are lower and the cost of transporting materials to buyers higher. As higher cost centers close, the state uses a lower cost average. That pushes more centers to close.
As the number of centers to redeem consumer deposits shrinks, companies operating curbside municipal recycling programs, waste haulers, and beverage retailers
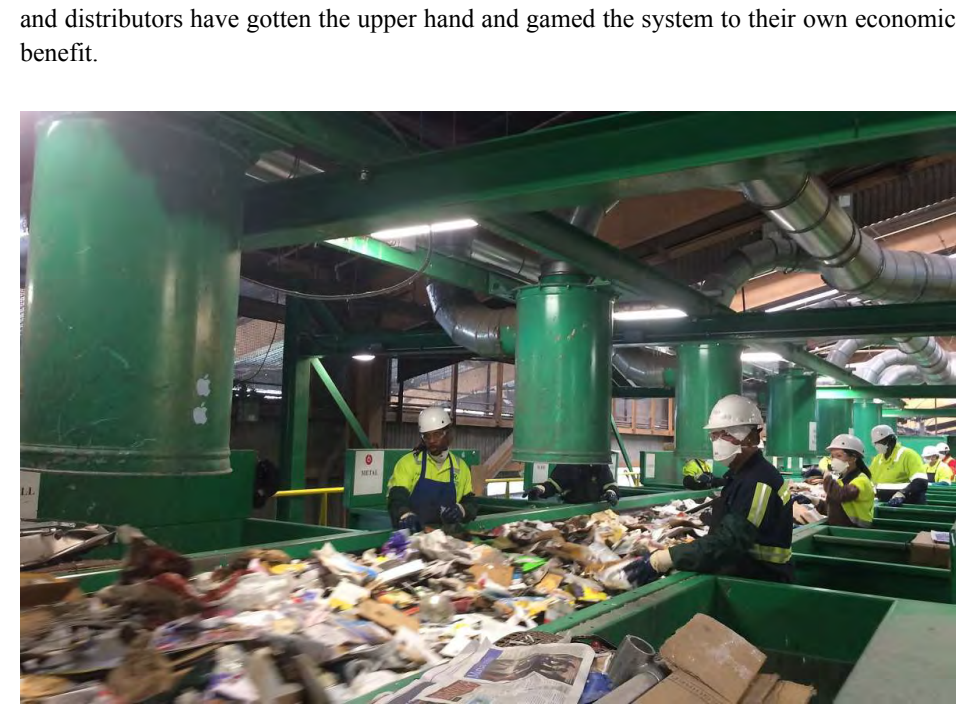
and distributors have gotten the upper hand and gamed the system to their own economic benefit.
!6.
GROCERS AND BOX STORES HAVE PUT UP “DO NOT DISTURB” SIGNS Beverage retailers that generate more than $2 million in revenue annually are statutorily obligated to help establish independently-run recycling centers in convenience zones. California is divided into nearly 4,000 convenience zones. The zones range from half a mile in radius in urban and suburban areas to three miles in rural locations. Each zone is supposed to have at least one recycling center and retailers are required by law to help make it happen.
The state pays extra fees to hundreds of these centers that locate on supermarket property to increase consumer convenience. However, centers are closing, likely due to economic hardship. In some cases, grocers and big box stores drive recycling centers located on their properties out by raising rents and through evictions. Enforcements by CalRecycle close a few centers as well.
Currently, retail chains, including some of the biggest—Walmart/Sam’s Club, Albertson’s/Safeway, and Vons/Pavilions—are failing to serve 64 percent of convenience zones, according to CalRecycle.
Retailers in convenience zones with no recycling center are obligated by law to redeem containers in store, or pay a $100 daily fee to the recycling program. But as redemption centers close and consumer access to bottle deposit refunds is restricted, retailers that should Albertson’s/ take their bottles back aren’t.
Safeway and
In the Bay Area, for example, the Save Mart grocery chain
Walmart/
said that as recycling centers close, almost 40 Lucky and FoodMaxx stores no longer have recycling centers near them. The
Sam’s Club
Mercury News reported that the retailer chose not to redeem
alone have
containers inside the stores because “there is no room to do so in a sanitary way and because of the cost of paying out the9
each been
redemption values to customers.” The chain chose to pay a daily
granted more
$100 fee per store instead. Yet, it is unclear how many stores that opt to pay the fee really are and whether CalRecycle properly
than 100 state
enforces it. Out of ten states with bottle deposits, California is only one of two states that consistently and readily allow retailers
exemptions.
to opt out of certain redemption requirements.
CalRecycle data shows that chains have been granted more than 1,200 exemptions by CalRecycle starting in 1987. Nearly half of those were granted after 2013.
!7.
Percent of Each Major Grocery Store Chain With a Redemption Center, 2018
No. of Zones Total % % Not Grocery Store ChainExempt Not ZonesServedserved ZonesServed Albertsons & Safeway10225337332%68% Costco Wholesale407712438%62% El Super11165872%28% Food 4 Less415012861%39% Food Maxx Store17315443%57% Grocery Outlet579714533%67% Lucky Store22617215%85% Northgate Gonzalez Market10144871%29% Raleys Supermarket18456227%73% Ralphs Grocery + Ralphs Fresh Fare + Ralphs 5311919439%61% Marketplace Save Mart31527026%74% Smart & Final / Smart & Final 9217425933%67% Extra Sprouts Farmers Market327810727%73% Stater Bros Market397717456%44% Superior Grocers11195666%34% Trader Joes Market5713618024%76% Vallarta Supermarket13185567%33% Vons Market + Vons Foods 7114922534%66% and Drug + Pavilions Walmart Supercenter + Walmart Neighborhood 10318024827%73% Market + Sam’s Club Whole Foods Market + 3653378847%93% Albertson’s/Safeway and Walmart/Sam’s Club alone have each been granted more than 100 state exemptions.
!8.
| Grocery Store Chain | No. of Exempt Zones | Zones Not Served | Total Zones | % Served | % Not served |
|---|---|---|---|---|---|
| Albertsons & Safeway | 102 | 253 | 373 | 32% | 68% |
| Costco Wholesale | 40 | 77 | 124 | 38% | 62% |
| El Super | 11 | 16 | 58 | 72% | 28% |
| Food 4 Less | 41 | 50 | 128 | 61% | 39% |
| Food Maxx Store | 17 | 31 | 54 | 43% | 57% |
| Grocery Outlet | 57 | 97 | 145 | 33% | 67% |
| Lucky Store | 22 | 61 | 72 | 15% | 85% |
| Northgate Gonzalez Market | 10 | 14 | 48 | 71% | 29% |
| Raleys Supermarket | 18 | 45 | 62 | 27% | 73% |
| Ralphs Grocery + Ralphs Fresh Fare + Ralphs Marketplace | 53 | 119 | 194 | 39% | 61% |
| Save Mart | 31 | 52 | 70 | 26% | 74% |
| Smart & Final / Smart & Final Extra | 92 | 174 | 259 | 33% | 67% |
| Sprouts Farmers Market | 32 | 78 | 107 | 27% | 73% |
| Stater Bros Market | 39 | 77 | 174 | 56% | 44% |
| Superior Grocers | 11 | 19 | 56 | 66% | 34% |
| Trader Joes Market | 57 | 136 | 180 | 24% | 76% |
| Vallarta Supermarket | 13 | 18 | 55 | 67% | 33% |
| Vons Market + Vons Foods and Drug + Pavilions | 71 | 149 | 225 | 34% | 66% |
| Walmart Supercenter + Walmart Neighborhood Market + Sam’s Club | 103 | 180 | 248 | 27% | 73% |
| Whole Foods Market + 365 | 33 | 78 | 84 | 7% | 93% |
| CRI compilation of CalRecycle data. | |||||
| Albertson’s/Safeway and Walmart/Sam’s Club alone have each been granted more | |||||
| than 100 state exemptions. |
According to California law, stores can win exemptions if recycling centers there would not be economically viable, if another redemption center is sufficiently close by, or if consumers there predominantly use curbside services, according to CalRecycle’s10 website.
Exempting stores merely because stores say consumers prefer throwing bottles into the trash or municipal recycling bins is not a logical reason for an exemption. Consumers would likely bring bottles to the store if they knew that was an option. Supermarket exemptions are supposed to be reviewed periodically, but some still date back to the 1980s and 90s, though circumstances may have changed.
ACCOUNTING SCAMS UNPUNISHED Beverage dealers and distributors operating in California are legally responsible for collecting, reporting and paying bottle deposits to CalRecycle for all beverages covered under its recycling program, from bottled water to juice and soda, that are made in the state or imported from out-of-state suppliers and sold to consumers in California. Beverage manufacturers are also responsible for paying “processing fees” to CalRecycle when the cost of recycling their containers exceeds the value for the scrap. What the industry pays in processing fees
In the rare case
makes up only a small portion of state processing payments to recyclers. The lion’s share comes from consumers’ unredeemed
an audit is
deposits.
performed, the
At the same time, the beverage industry routinely scams the bottle recycling program by undercounting, miscoding, and
state has found
failing to report sales. In the rare case an audit is performed, the state has found millions of dollars undercounted. Companies are
millions of
not fined for stealing this money from consumers and the
dollars
program and cases are not publicized.
CalRecycle audits only 1 to 2 percent of retailers, beverage distributors and manufacturers each year. The undercounted.
California State Auditor found in 2010 that CalRecycle does not consistently audit all distributors and had either not completed or not started a dozen audits of its top 100 beverage distributors or of 67 of 309 mid-sized distributors. Nor did11 it always audit distributors previously identified as underpaying to check for recidivism. The Auditor found CalRecycle is potentially missing cases of fraud because it has no “formal systematic and documented methodology for analyzing data regarding the volume of recycled containers.”
!9.
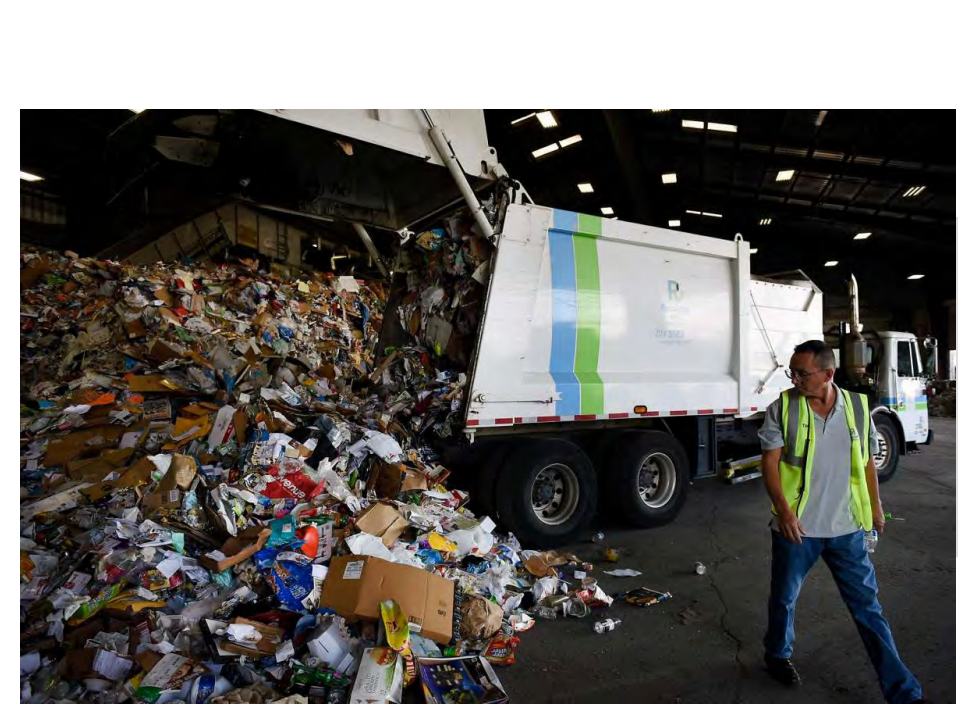
Californians were shorted by at least $206 million in 2014 by beverage retailers and distributors that failed to remit deposits to CalRecycle based on state data and market12 research.
In 2016, CalRecycle conducted audits of more than 60 beverage distributors, or 1.4% of the 4,177 beverage distributors in the state. Of the 63 distributors audited, 50 of13 them were found to owe money to CalRecycle.
The largest of these, Walmart, was found to owe $14.5 million. CalRecycle caught Walmart failing to submit accurate distributor reports and deposit payments on cases of14 beverages sold in California. The beverage retailer and distributor also did not submit accurate beverage manufacturer reports and processing fees.
In 2016, CalRecycle found that Walmart had failed to include the sales of 89 deposit-eligible products in its reported deposit totals. That meant that $6.8 million worth of deposits were underreported. In addition, Walmart incorrectly coded 73 different products as ones that did not require deposit collection. That error resulted in the underreporting of $489,000 worth of deposits. CalRecycle also found that Walmart inconsistently included the sales of some products subject to processing fees in its reported processing fee totals.
!10.
Walmart paid up the total of what it owed. But the company didn’t even get a wrist-slap fine. “Wal-Mart (sic) was very cooperative and addressed the issue in a timely manner, so CalRecycle does not believe penalties were warranted,” said CalRecycle spokesman Mark Oldfield said in 2017. “However, interest was charged on the balances due.”
There is no incentive for companies to follow the law, track or report their sales accurately when the worst penalty they face is repaying the money they owe. ADDITIONAL ADMINISTRATIVE FEES Beverage distributors are also rewarded for participating in the program with state-sanctioned skimming. Beverage distributors are allowed to keep 1.5 percent of all deposits consumers pay into the system—nearly $20 million last year—to cover the
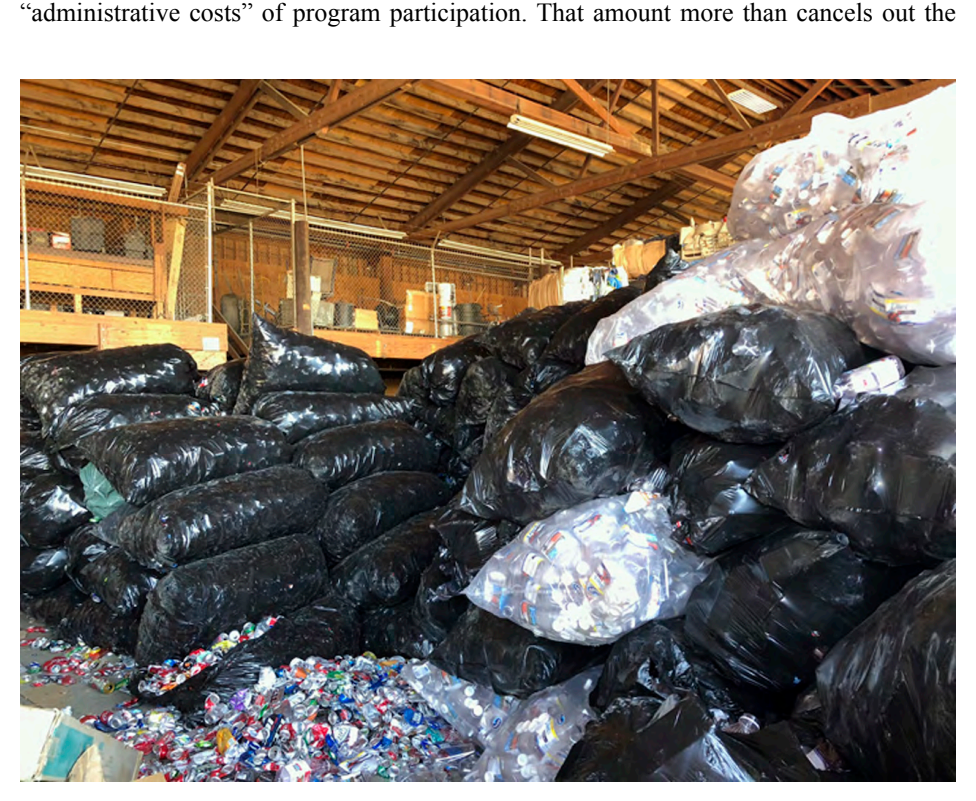
“administrative costs” of program participation. That amount more than cancels out the !11.
processing payments beverage manufacturers pay to make up the difference in the cost of recycling their containers versus the market value of the materials.
The state has never reviewed and proven what it really costs for beverage companies to participate in the program, according to the state Legislative Analyst’s15 Office (LAO).
HAUL-IN CASH Municipal curbside and drop off programs, and trash haulers, benefit from the redemption of containers that consumers throw into the trash, in addition to other state subsidies. These programs collected $126 million in 2017 in consumer deposits alone. While curbside haulers and drop off centers take in 12 percent of the beverage containers under the recycling program, the recycling centers take in 88 percent. But the haulers and drop off centers get so many additional state payments that they made $14916 million in net 2017 profits, according to new CRI analysis. That is a 347 percent profit. In contrast, recycling centers cannot stay afloat on what the state pays them and are closing.
California recycling centers that redeem most empty beverage containers produce cleaner materials for recycling, especially glass, keeping down litter and greenhouse gases. But trash haulers and curbside municipal programs processing the rest only increase contamination rates. That results in decreased recycling and increased landfilling.
Yet curbside programs are paid by the state when they do nothing to increase consumer redemptions. These programs
Curbside
are collecting consumer deposits plus tens of millions of
haulers have up
dollars in direct payments from the state. On top of that, waste haulers also generate revenue from collecting, processing, and
to three sources
landfilling both recyclables and trash, a steady and profitable
of steady
source of income.
Recycling centers, on the other hand, have been
revenue and
underpaid by the state by $43 million between 2013 and 201617
never pay a cent
alone. Recyclers were shorted this amount of processing fees based on outdated calculations of scrap prices and a steep
to consumers for
decline in scrap values, as well as a decline in revenues from profitable aluminum. Nor did CalRecycle increase payments to
their containers.
cover automatic minimum wage increases in 2017-2019.
!12.
Curbside haulers, including waste haulers, have up to three sources of steady revenue and never pay a cent to consumers for their containers. The recycling centers depend on the whims of the global market and an ever-decreasing state payment formula for revenue and pay consumers for the bottles they return. The system sets up haulers to win and centers to fail.
California’s Ten Counties with Most Scarce Redemption Centers
No. of No. of No. of No. of People Served Recycling Recycling Recycling Recycling per Single County Centers Centers Centers Centers % Redemption (2012)(2017)LostLostCenter in 2017 Marin32133%131,802 San Francisco2291359%97,136 Sonoma2471771%72,160 Contra Costa42182457%63,306 Santa Clara58322645%60,568 San Mateo25131248%59,246 23 Alameda512845%58,763 Tuolumne31267%54,707 San Luis Obispo2071365%40,014 Solano23131043%33,540 SINGLE STREAM RECYCLING About 80 percent of curbside haulers in cities and towns use a “single stream”18 method of gathering recyclables. People put their recyclables into one bin and trucks take them to a processing center where machinery sorts the materials. But during transport, the materials are jostled together, rendering at least one quarter of the materials useless because they are contaminated with ground-in bits of organic waste, paper, plastic and metal.
Yet CalRecycle pays curbside haulers a $15 million annual “curbside supplemental” recycling subsidy in addition to $10 million a year as a “quality incentive19 payment” to improve glass sorting and cleaning and to reduce contamination. But !13.
| County | No. of Recycling Centers (2012) | No. of Recycling Centers (2017) | No. of Recycling Centers Lost | No. of Recycling Centers % Lost | People Served per Single Redemption Center in 2017 |
|---|---|---|---|---|---|
| Marin | 3 | 2 | 1 | 33% | 131,802 |
| San Francisco | 22 | 9 | 13 | 59% | 97,136 |
| Sonoma | 24 | 7 | 17 | 71% | 72,160 |
| Contra Costa | 42 | 18 | 24 | 57% | 63,306 |
| Santa Clara | 58 | 32 | 26 | 45% | 60,568 |
| San Mateo | 25 | 13 | 12 | 48% | 59,246 |
| Alameda | 51 | 28 | 23 | 45% | 58,763 |
| Tuolumne | 3 | 1 | 2 | 67% | 54,707 |
| San Luis Obispo | 20 | 7 | 13 | 65% | 40,014 |
| Solano | 23 | 13 | 10 | 43% | 33,540 |
CalRecycle appears never to have asked haulers to provide evidence that the payments do anything to reduce landfilling.
In contrast, the glass that goes through redemption centers is 98% clean, and needs very little processing to prepare it for market, making it a much cheaper process. Curbside recycling is convenient for consumers who think all of their contributions are being recycled. But most don’t realize that method has caused so much contamination of recyclable materials that China, long the U.S.’s biggest buyer of recyclable materials, cited it as a reason they no longer take “foreign garbage,” including20 used paper, plastics, and other scrap.
The effect has been for some towns, especially small towns where it is expensive to transport scrap to market, to limit the sorts of recyclables they accept, or to raise fees for curbside programs that continue to get state subsidies. Sacramento, for example, briefly stopped taking lower-quality plastics until the trash hauler Waste Management21 could find a buyer for it, according to The Washington Post.
CALRECYCLE’S PROBLEMS CalRecycle has been a toothless enforcer of the bottle law. It has often failed to ︎︎︎︎︎ conduct frequent and widespread audits of industry participants. It has not ︎publicly levied fines on beverage makers, distributors and dealers caught holding back deposits and other owed fees. And it ︎do︎es︎ ︎not educate consumers on which stores will take back bottles in unserved convenience zones by providing an easily accessible and understandable list on its website.
This division of CalEPA also fails to advocate for fundamental legislative reform of the system so that subsidies can be dispensed nimbly at the proper levels to recycling centers to keep them in business. At the same time, CalRecycle ︎︎︎has not scrutinized︎ a number of its other programs for cost-effectiveness. That includes allowing distributors to keep tens of millions of dollars off the top of collected deposits. In addition, CalRecycle is paying tens of millions of dollars in subsidies to trash haulers producing high levels of contaminated glass that is costly to clean up for use in making new bottles. Both haulers ︎ and municipal curbside recyclers collect full redemption value.
For unserved convenience zones, CalRecycle ︎does not properly regulate beverage retailers to ensure that those opting to take bottles back in-store actually do so. It essentially gives lifetime exemptions to stores by failing to periodically review the exemption to see if it is fair and warranted.
In fact, in one instance, the state appears to have suggested that a store deliberately evade its responsibilities to take bottles back, which appalled the store owner. In 2015 !14.
and 2016, the co-owner of a grocery in the Potrero Hill neighborhood of San Francisco paid $100 a day for not taking
She didn’t feel
bottles back in store. She said that the store was far too small to do so and specialized mostly in produce and fresh goods, not comfortable beverages. For two years, Kayren Hudiburgh had pushed for an
committing
exemption from CalRecycle with no result.
perjury and
“Frustrated, Hudiburgh had phoned CalRecycle and explained her predicament to a State employee,” reported The
22questioned how
Potrero View. “Astonishingly, she was advised to sign an
the revenue
affidavit agreeing to carry out the duties of a redemption center but not actually follow through. The rationale given was that the
from the fines
State only has seven investigators, and the risk of being caught is
is being used.
low. She then explained that she didn’t feel comfortable committing perjury and questioned how the revenue from the fines is being used.” Hudiburgh finally got her exemption after a recycling center opened nearby, but still had to pay another $5,900 for daily fees owed for the first two months of 2017.
The regulator also fails to keep track of whether stores that opt out from taking bottles in-store are paying the requisite amount in daily fees. CalRecycle reported in its January 2019 monthly meeting that as of the end of 2018, 171 stores are paying the $100 daily fee. If so, that would come to more than $6 million annually. But it reported separately in a November fund balance memorandum to the Department of Finance that it collected $3 million in miscellaneous fees, which are largely made up of these daily23 payments.
There are roughly 3,700 beverage dealers in unserved zones that have agreed to take back containers for recycling inside their stores. If each of these stores instead elected to pay a daily fee to the state of $100, rather than take bottles back in store, the state could collect a total of $135 million a year for the recycling program. Hundreds of stores have never even responded to CalRecycle on whether they want to pay the daily fee or take bottles back in store. According to a recent CalRecycle public presentation, as of December 31, 2018, 289 stores in unserved convenience zones had never informed the state about which option they preferred. Another 3,702 claimed to take bottles back in24 store.
!15.
FUZZY MATH AT CALRECYCLE CalRecycle also suffers from its own accounting mistakes. The beverage container program has been audited by the California State Auditor in 2010 and 2014,and by the26
Department of Finance six times between 2010 and 2016.
Bottle deposits have been the victim of state borrowing over the years to pay for everything from road repairs and mental health to bingo halls.From 2002 to 2010, the state general fund and other funds borrowed nearly $500 million from the beverage recycling fund to balance the general budget and pay for other programs.
Moreover, CalRecycle dramatically underreported the 2010 fund balance. The Governor’s budget for 2011-12 reported that the beverage recycling fund ended fiscal year 2010 with only seven million dollars when it actually contained $245 million, according to an audit by28 the Department of Finance.These accounting misstatements and borrowing from the fund led︎ to real-world consequences. When the program has a low fund balance, the state automatically makes proportional cuts to program participants across the board. The errors led to dramatic cuts in payments to recyclers that were unfairly shorted millions of dollars.
Audits of CalRecycle in fiscal years 2010-2014 found deficiencies in internal controls and material misstatements in the beverage container program’s financial statements. In 2016, the Department of Finance found that CalRecycle failed to send an amendment alerting the State Controller’s Office to new, significant financial information for submitted, end-of-year financial records. That amounted to a $17 million difference29 on the balance sheet.
CONCLUSION No other state has experienced the same precipitous drop in recent years in the number of recycling centers participating in state bottle recycling programs, according to the LAO’s 2017 review of other states.
!16.
Oregon just hit a 90 percent redemption rate in 2018, according to Oregon Public30 Broadcasting. Michigan’s rate stands at 92 percent. In that state, only retailers redeem the bottles, not recycling centers. Retailers get 25 percent of the value of unredeemed containers based upon the number of empty returnable containers they handle. That provides an incentive to take those empties back. The deposit is also higher in Oregon and Michigan, a dime as opposed to a nickel, which incentivizes higher redemption rates. There is no reason that California cannot raise its redemption rate sharply, towards 100 percent, with the right overhaul of its beverage container recycling program. In order to begin that reform, Consumer Watchdog recommends: The Governor and Legislature should overhaul the bottle bill program to achieve the following objectives: ✓Set a redemption rate target of 90%.
Create financial incentives and penalties for industry players to reach that goal, ✓ and potentially raise the bottle deposit.
Improve convenience by expanding the number of locations where consumers may ✓ redeem their beverage containers.
Overhaul CalRecycle to make it more responsive to consumer needs and less to ✓ special interests.
Until structural reform to the program is undertaken, the following changes to the program should be taken now: Reimbursement formulas should favor consumers and redemption centers, not ‣ politically-connected curbside haulers and trash collectors.
‣CalRecycle should provide consumers a quick and easy way to look up what stores in unserved convenience zones must take bottles back in store, as well as report directly to CalRecycle when a store obligated to take their bottles back refuses. CalRecycle should perform surprise inspections on retail stores that opt to take ‣ bottles back in store to see if they are, and impose penalties if they are not. CalRecycle should require all stores of a sufficient size in unserved convenience ‣ zones to take bottles back in store without exemptions.
CalRecycle should dramatically increase the number of company audits it performs ‣ to recoup tens of millions of dollars it is now forgoing and publicize the findings. CalRecycle should impose fines on retailers or distributors cheating the system and ‣ publicize them.
!17.
CITATIONS1 California’s Beverage Container Recycling and Litter Reduction Fact Sheet, CalRecycle, June 2018. Derived from adjusted “CRV-in” and “CRV-out,” adjusted to remove administrative fees.2 CalRecycle’s 2013 Fact Sheet listed 2,578 buyback centers, compared to 1,588 centers listed on the 2018 Fact Sheet.3 For the CalRecycle fund balance documents, see: https://consumerwatchdog.org/sites/ default/files/2019-01/Recycling%20Bill%20and%20Slides.pdf (opens in new tab)4 For a simple explanation of the bottle bill, see: http://www.bottlebill.org/legislation/usa/ california.htm (opens in new tab)5 As of May 2018, CalRecycle’s June 2018 Fact Sheet reflected 1,588 recycling centers that buy back bottles. As of December 2018, CalRecycle listed 1,554. A total of 32 centers closed in just six months.6 The calculation is documented in “The Skim” on page 3. It should be noted that while consumers that made deposits only receive 54% of the deposit back directly, the calculation conservatively estimates that 10% of bottles and cans returned at redemption centers are exchanged by someone other than the consumer who paid the deposit, which are bulk collectors or so-called “gleaners.” The money does not go to the consumer, but the cans and bottles are recycled and a revised redemption rate should include these materials. We recommend CalRecycle collect data related to and publish its own analysis of bulk returns by gleaners, as 10% is by all accounts a conservative estimate.7 California’s population of 40 million is served by 1,553 redemption centers, per CalRecycle’s presentation, Beverage Container Recycling Program, Certification and Registration Branch, 4 Quarter 2018, presented in January 2019.8 For CalReycle’s 2017 Processing Fee and Handling Fee Cost Surveys and Final Report, see pages 58 and 59: https://www2.calrecycle.ca.gov/Publications/Download/1349 (opens in new tab)9 For more on retailers and recycling centers in the Bay Area, see: https:// www.mercurynews.com/2017/06/17/recycling-centers-continue-to-struggle-driving-california-recycling-rates-down/ (opens in new tab)10 For more on exemptions and other program rules, see: https://www.calrecycle.ca.gov/ bevcontainer/retailers/zones (opens in new tab) !18.
For the State Auditor’s fact sheet on CalRecycle audit failures in 2010, see: https:// www.auditor.ca.gov/pdfs/factsheets/2010-101.pdf (opens in new tab)12 CRI calculated the figure of $206 million in deposits that should have been collected were not remitted to the state by comparing total California beverage sales reported by retailers and distributors to CalRecycle with purchased market data on beverage sales. Retailers’ and distributors’ marketing figures show that billions more bottles were sold in the state than reported to CalRecycle, CRI found. CRI’s report: Examining the Potential for Increased Revenues in California’s Beverage Container Deposit-Return Program, August 13, 2014, page 413 See https://www.consumerwatchdog.org/sites/default/files/2019-02/f_jsm9schw2.pdf (opens in new tab)14 See https://www.consumerwatchdog.org/sites/default/files/2019-02/ Walmart_Resource.pdf (opens in new tab)15 For more on the LAO’s assessment of the state’s beverage container recycling program, see: https://lao.ca.gov/handouts/resources/2018/BCRP-Overview-030718.pdf (opens in new tab) The LAO has performed several reviews of the program. For more see: https://lao.ca.gov/Publications/Report/3649 (opens in new tab) https://lao.ca.gov/Publications/Report/3466 (opens in new tab) https://lao.ca.gov/handouts/resources/2016/Overview-BCRP-042116.pdf (opens in new tab) https://lao.ca.gov/handouts/resources/2015/Beverage-Container-Recycling-031215.pdf (opens in new tab) https://lao.ca.gov/reports/2015/res/recycling/beverage-container-042915.aspx (opens in new tab)16 For CRI’s analysis of curbside and drop off program profits from beverage containers, see: https://www.consumerwatchdog.org/sites/default/files/2019-02/ Duty%20to%20Warn%20J.%20Gitlitz%20slides%20JG%233.pdf (opens in new tab)17 For how processing payment shortfalls threaten the integrity of California’s beverage container deposit system by starving recyclers out of business, see CRI’s report here: http://www.container-recycling.org/images/stories/PDF/ Processing%20Payment%20Shortfall%20report%20April%202016%20update.pdf (opens in new tab) CRI used CalRecycle data, actual scrap value, cost of recycling data and processing payment data for this 2016 report.18 For more on single-stream trends and their effect on contamination, see: https:// fivethirtyeight.com/features/the-era-of-easy-recycling-may-be-coming-to-an-end/ (opens in new tab)19 See CalRecycle’s June 2018 Fact Sheet.
!19.
For more on China and its rejection of American waste, see: https://www.huffingtonpost.com/entry/china-recycling-waste-ban_us_5a684285e4b0dc592a0dd7b9 (opens in new tab) and https://www.nytimes.com/2018/05/29/climate/recycling-landfills-plastic-papers.html (opens in new tab)21 To read the Washington Post article on the pitfalls of single-stream recycling and world markets for scrap, see: https://www.washingtonpost.com/national/health-science/a-move-by-china-puts-us- small-town-recycling-programs-in-the-dumps/2019/01/18/6a043642-1825-11e9-8813- cb9dec761e73_story.html?noredirect=on&utm_term=.bf103f93056a (opens in new tab)22 For the Potrero View article, see: https://www.potreroview.net/good-life-grocery- grapples-with-bottle-bill-fines/ (opens in new tab)23 For the CalRecycle fund balance documents, see: https://consumerwatchdog.org/sites/ default/files/2019-01/Recycling%20Bill%20and%20Slides.pdf (opens in new tab)24 For the CalRecycle presentation, see: https://www.consumerwatchdog.org/sites/default/ files/2019-02/D. %20Information%20Item%201%20%26%202%20Presentation%20PDF.pdf (opens in new tab)25 https://www.bsa.ca.gov/pdfs/factsheets/2010-101.pdf (opens in new tab) and https://auditor.ca.gov/reports/summary/2014-110 (opens in new tab)26 https://esd.dof.ca.gov/reports/report.html (opens in new tab)27 For more on California’s more than 500 “special funds,” see: https:// www.mercurynews.com/2012/07/28/while-california-struggles-to-pay-its-bills-states-special-funds-flush-with-cash/ (opens in new tab)28 For the CalRecycle audits, see: https://www.consumerwatchdog.org/sites/default/files/2019-01/CalRecycle%20Audit.pdf (opens in new tab)29 For the 2018 CalRecycle audit, see: https://consumerwatchdog.org/sites/default/files/ 2019-01/ Department%20of%20Resources%20Recycling%20and%20Recovery%20Financial%20 2016%20California%20Beverage%20Container%20Recycling%20Fund%20July%20201 8.pdf (opens in new tab)30 For more on Oregon’s bottle recycling program, see: https://thehill.com/policy/energy-environment/428377-oregon-bottle-recycling-rate-hits-record-high (opens in new tab) !20.